4 Pillars of Analytics

written by Julien Kervizic
There are four key pillars that rule the lifecycle of analytics projects, from data acquisition, processing to surfacing and actioning on the data. Each of these contribute to a significant part of the value chain of analytics.
Pillar 1: Acquisition
The data acquisition pillar consists of a wide range of tasks, system and technology knowledge, one needs to possessed in order to be effective in acquiring the required data. What is required from analytics professional is very domain dependent.
Types of data

With respect to data acquisition, we can consider four main types of data Clickstream, Databases APIs and Logs, each have their own challenges and ways to handle data collections.
Clickstream data is generally obtained through integration with a tool such as google analytics or adobe analytics. The role of clickstream data is to provide an understanding of user behavior on the site or apps that we are running. The default version is to extract raw data from such a source through Google Big Query (for Analytics 360), if this is unavailable open source tools such as Snowplow or Divolte can help integrate collect raw clickstream data to a big data platform.
The role of the Analytics practitioner here, is to define the metrics for collection, setup goals within the analytics tools, help setup extra logging, analyze user paths, handle experiments setup and deep dives.
Databases is normally the source of information for internal system information that need to be persisted. It usually contains transactional information, relationships between different objects, profile informations etc.. The traditional method for extraction out of databases is SQL. Datasets are usually queried and extracted either as snapshot or a sequence of events depending on the form of the data.
The role of the analytics practitioner with respect to acquisition of data within this domain is to model and structure the data needed to be exported from these databases. The practitioner needs to be merging and deep diving into the data-sets in order to extract valuable data out of it. The end result being reports, dashboards, extracts for statistical modeling, etc.. The analytics practitioner needs to work trying to extract data out of these systems need to work with the engineering team to make sure the right data attributes are being captured within these databases, make sure that there is a quality process on the different data inputs etc.
API calls is the usual way of acquiring data, when dealing with external systems. This can be for instance acquiring data from operating a webshop on amazon to getting some metrics related to your ad spend on Facebook or through getting some information from some external data provider.
The analytics practitioner trying to acquire these types of data needs to spend significant times looking at the different API end points, prototyping API calls, getting some understanding on these external data and structuring them into a format that is usable for internal use cases.
Logs are another source of data, usually captured within internal systems to store and analyze events data. Usually handled as data streams with Terms such as data firehose and stored in Big data platforms.
The analytics practitioner trying to acquire Logs data, typically spend a lot of time on working on optimizing their code to process the data-streams and on monitoring the ingestion of these data. He works with the engineering team on capturing essential information within these data-streams or on making attributes directly available to make data collection a more efficient endeavour.
Architecture for Data Collection
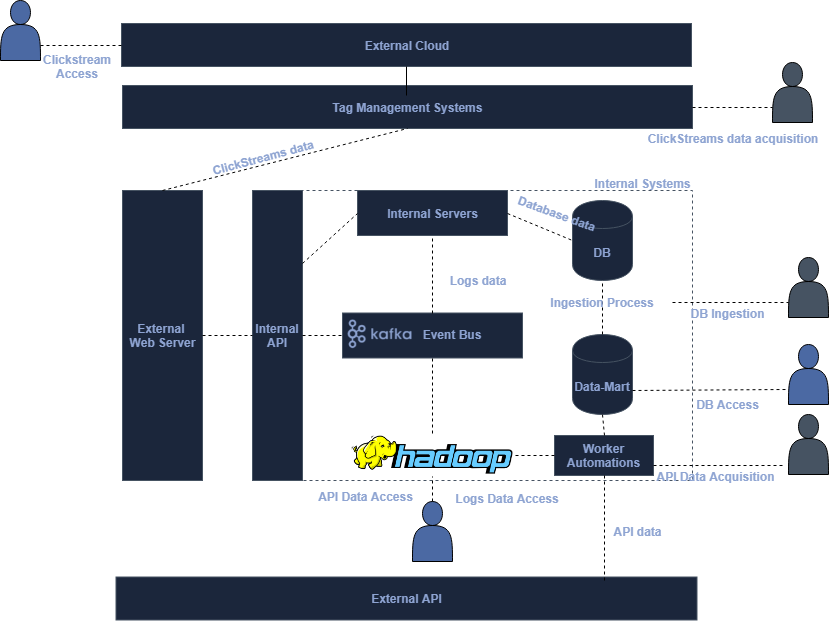
Clickstream data acquisition: Analytics practitioners trying to acquire new clickstream data, typically define new events or attribute to be collected within the tag management system. Data is then sent from users visiting a page hosted by an external webserver to an external cloud like the Google Cloud or Adobe’s for data collection and processing purpose. Users can typically access the raw and processed directly from these cloud in a seamless manner.
Database data Acquisition: Internal servers store information within a database as part of their processes. Development teams need to make sure the right information is stored within those. In order to ingest the information for analytics purposes, these production databases need often to be replicated and operation need to be performed onto them to extract the right kind of information needed.
API data Acquisition: Calls to external servers need to be made in this specific case, a worker needs to be produced that calls the different API end points and structure the data for ingestion. Data is then placed either in a database, usually a data-mart or onto a big data file system.
Logs data acquisition: Logs data is collected either as part of a process to put events onto an event bus from an API or through an internal log collection process. Once onto an event bus, they can be pushed to a a big data platform or potentially a database through a data sink connector.
Technology Knowledge
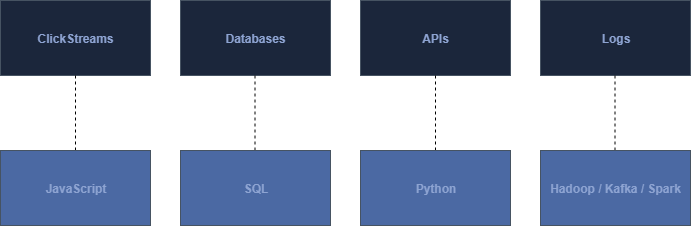
Each of these data domains, requires some specific type of knowledge in order to be able to fully execute onto a data acquisition process.
Clickstreams: For obtaining clickstream data, Javascript knowledge, especially jQuery and tag management systems is useful to have in order to be able to define what type of events or attributes need to be ingested by the systems.
Databases: In order to extract data from a database thorough knowledge of SQL is needed, for more advanced operations knowledge of ETL tools such as Airflow might be good to have.
APIs: Knowledge on how to interact with APIs, including Authorization, SOAP and REST APIs as well as programming knowledge is needed to be able to interface with these type of data sources.
Logs: Interaction of log data tend to be a bit more technical than the other data sources mentioned before. Log data tend to be operated at very high level and are sometimes acquired and process in real-time. The typical frameworks for operating on log data tend to be working with Spark and Kafka and pushing it for long term storage or offline processing onto a Hadoop platform.
Pillar 2: Processing
The data processing pillar is responsible to transform raw data and refine it into informative data. It consist of different sub tasks that need to be processed on datasets, cleansing, combining and structuring the datasets, handling aggregation as well as performing any additional advanced analytics processing on top of the data.
Cleansing
Data cleansing is a task everybody working in the field of analytics must do, it requires to deep dive into the data and looking for potential gaps or anomalies, trying to structure the data in a way that it could tackle most of the problems.
At the heart of data cleansing a few types of data cleansing need to be performed:
- Missing values: How to identify missing value and impute these when needed, when full set of data are missing determine how these should be treated.
- Text normalization: Text fields need to be normalized across (a) dataset(s), within free form fields, data need to be formatted into common identified words …
- Categorization: Certain inputs need to be matched against certain metadata.
- Id Matching: Ids that are different depending on the source of information need to be matched together in order to allow merging and resolving of a single identity.
- Deduplication: Certain events or data could be duplicated within a dataset, identifying these occurrence and removing them from the dataset is part of the cleaning process.
- Miss Attribution: In some cases some rows of the data could be miss attributed to a given source. These would need to be identified, potentially excluded from the data-set or re-attributed where possible.
The identification and cleaning of each of these cases is a time consuming effort that needs to be performed to a certain degree within each data sources through performing data audits, looking at replicating where possible the cause of the bad data and working with the engineering teams to fix the problem long term.
Merging and Denormalizing
Another step of the data processing pillar is the merging and denormalization of data-sets. Looking at combining different data-sets together and making more actionable and easily queriable data-sets.
Understanding the concept of grain of a data-set, and the normal forms of data is helpful in operating this part. Another part of the merging and denormalization process is to set-up the dimension and metrics. The process of merger and denormalization is to make a dataset that is available for further uses that contains the relevant information needed for further processing in an easy way.
Aggregation
Different levels of aggregations are needed for different purposes, there are different levels of aggregations needed for different purposes:
- Temporary processing, this essentially consists of a materialized subqueries that can be used to provide additional information downstream in an effective manner.
- Full datasets extracts, providing key metrics for reporting or slice and dice purposes. Sometimes using the CUBE aggregation function to enable exports to OLAP databases.
- Customer level aggregations, used for analysis and additional processing, these serve as a way to generate a customer profile that can then be used for analytical or modeling purpose — for instance to model churn.
Advanced Analytics Processing
Different advanced analytics and machine learning method can be applied on top of the aggregates that have been computed, ranging from clustering methods to propensity modeling using methods such as random forrest or others. The purpose of the advanced analytics step is to create synthetic data that can be have predictive power and purpose in decisioning.
Pillar 3: Surfacing
Informative data needs to be surfaced in an effective manner to be meaningful. Different methods of data surfacing exists ranging from making data available into a dashboard or standard report, an analysis deck an OLAP cube or just opening data as a service.
Dashboards and standard reports
Dashboard and standard reports tend to be the first way to share the processed information. It usually sits within the performance measurement part of the role of an analytics professional. I previously explained how the measurement processed benefits from a data surfacing strategy, dashboards and standard reports are an integral part of this.
Dashboards/Reports tend to be the first user facing deliverable of analytics practitioner, can help in getting buying and can help in providing stakeholders confidence that an analytics project is on track.
Analysis decks
Analysis decks and reports tend to be another way to share the insights gleaned during the different of the analytical process. Depending on the technicality of the tasks and of the intended audience, the report tend be shared as a powerpoint, a word document or a plain jupyter notebook.
OLAP datasets
OLAP cubes allow for slice and dice processing of data, it is particularly effective tool for highly dimensional datasets. Open source tools such as druid enable this type of processing. From a data-surfacing point of view, setting up aggregates that can be dived into easily by the business or product teams allows to empower these teams while removing certain sets of questions and tasks normally tackled by the analytics professional.
System Integration
While the other methods of data surfacing focused on surfacing data and information directly to humans this one is intended to be directly for machines. Integrating aggregates and predictions into production systems, be it by offering an API, storing them in to Database Tables, surfacing file exports … Is another way an analytics professional can surface data, in this case to be used directly within products or processes.
Pillar 4: Action
We can sometimes see analytics being divided within 3 separate subdomain Descriptive, Predictive and Prescriptive Analytics. This separation is in my view quite restrictive, analytics to be useful should be prescriptive but it can use statistical or modeling techniques that are descriptive or predictive for instance. Providing a churn propensity for instance without taking it into the context of a decision rule that action this information is merely
Analytics without action is just research, there has been a lot of talk about analytics need to provide actionable insights. In my view it is not actionable insights that should be the holy grail of analytics but really the conversion of these insights into effective actions. McKinsey Consulting has advise to focus on last mile of Analytics and of embedding analytics into the decision making process of the organization, this helps in this conversion process but analytics professionals should still be the flag bearer of this process rather than purely relying on it from an organizational perspective.
*Source: Medium
About Me
I'm a data leader working to advance data-driven cultures by wrangling disparate data sources and empowering end users to uncover key insights that tell a bigger story. LEARN MORE >>
comments powered by Disqus